Pinal County, Arizona

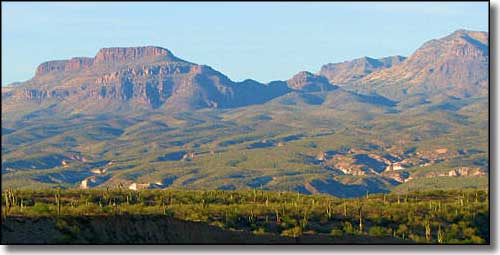
A typical view in Pinal County
Pinal County is in south-central Arizona. The Superstition Mountains, Lost Dutchman Mine and Casa Grande Ruins National Monument are here. Pinal County contains 5,370 square miles of land and 4 square miles of water. The county seat is Florence.
The northwestern part of the county is part of the Phoenix Metro area while the southeastern part of the county has been prominent in the past as a major copper mining area.

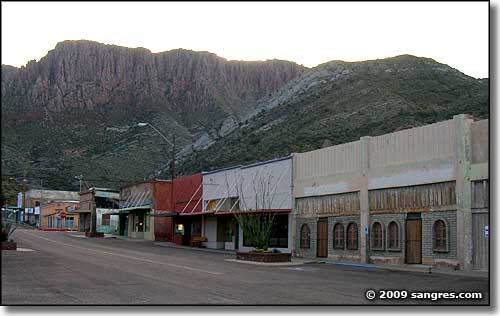
Downtown Superior, Apache Leap in the background
Fast Facts about Pinal County, Arizona
Types of Jobs:
Private Sector, wages or salary: 73%
Government Sector: 21%
Unincorporated, Self-Employed: 6%
Population Density: 63 People per Square Mile
2011 Cost of Living Index for Pinal County: 87.8
Median Resident Age: 37.1 Years
Private Sector, wages or salary: 73%
Government Sector: 21%
Unincorporated, Self-Employed: 6%
Population Density: 63 People per Square Mile
2011 Cost of Living Index for Pinal County: 87.8
Median Resident Age: 37.1 Years
2009 Estimates:
Estimated Median Household Income: $48,850
Estimated Median Home Value: $137,800
Major Industries:
Government, Construction, Health Care, Educational Services, Lodging & Food Services, Agriculture, Waste Management Services, Social Services, Entertainment & Recreation, Retail Services, Finance & Insurance Services
2010 Population Demographics
| Total Population | 375,770 |
| Males | 197,165 |
| Females | 178,605 |
| Population by Age | |
| Under 18 | 99,700 |
| 18 & over | 276,070 |
| 20-24 | 21,171 |
| 25-34 | 56,746 |
| 35-49 | 73,018 |
| 50-64 | 64,537 |
| 65 & over | 52,071 |
| Population by Ethnicity | |
| Hispanic or Latino | 106,977 |
| Non Hispanic or Latino | 268,793 |
| Population by Race | |
| White | 272,013 |
| African-American | 17,215 |
| Asian | 6,492 |
| Native American | 20,949 |
| Hawaiian or Pacific Islander | 1,565 |
| Other | 43,213 |
| Two or more | 14,323 |
