Yavapai County, Arizona

Yavapai County Courthouse in Prescott
Cities & Towns:
Camp Verde
Chino Valley
Clarkdale
Cottonwood
Dewey-Humboldt
Jerome
Prescott
Prescott Valley
Sedona
Camp Verde
Chino Valley
Clarkdale
Cottonwood
Dewey-Humboldt
Jerome
Prescott
Prescott Valley
Sedona
Yavapai County is in north central Arizona, between Phoeniz and Flagstaff. Yavapai County contains 8,123 square miles of land and 4 square miles of water.
About 50% of Yavapai County is owned by the federal government. Another 25% of Yavapai County is owned by the State of Arizona. The county seat is Prescott.

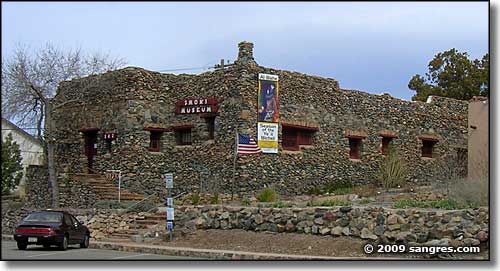
Smoki Museum in Prescott
Fast Facts about Yavapai County, Arizona
Types of Jobs:
Private Sector, wages or salary: 73%
Government Sector: 14%
Unincorporated, Self-Employed: 13%
Population Density: 27 People per Square Mile
2011 Cost of Living Index for Yavapai County: 89.6
Median Resident Age: 44.5 Years
Private Sector, wages or salary: 73%
Government Sector: 14%
Unincorporated, Self-Employed: 13%
Population Density: 27 People per Square Mile
2011 Cost of Living Index for Yavapai County: 89.6
Median Resident Age: 44.5 Years
2009 Estimates:
Estimated Median Household Income: $40,400
Estimated Median Home Value: $217,300
Major Industries:
Lodging & Food Services, Construction, Health Care, Educational Services, Government, Professional Services, Waste Management Services, Finance & Insurance Services, Social Services
Estimated Median Household Income: $40,400
Estimated Median Home Value: $217,300
Major Industries:
Lodging & Food Services, Construction, Health Care, Educational Services, Government, Professional Services, Waste Management Services, Finance & Insurance Services, Social Services
2010 Population Demographics
| Total Population | 211,033 |
| Males | 103,458 |
| Females | 107,575 |
| Population by Age | |
| Under 18 | 40,269 |
| 18 & over | 170,764 |
| 20-24 | 10,167 |
| 25-34 | 18,552 |
| 35-49 | 34,065 |
| 50-64 | 52,440 |
| 65 & over | 50,767 |
| Population by Ethnicity | |
| Hispanic or Latino | 28,728 |
| Non Hispanic or Latino | 182,305 |
| Population by Race | |
| White | 188,515 |
| African-American | 1,267 |
| Asian | 1,785 |
| Native American | 3,549 |
| Hawaiian or Pacific Islander | 213 |
| Other | 10,346 |
| Two or more | 5,358 |
