Hooper, Utah

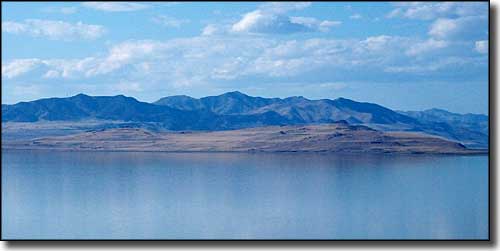
Fremont Island - the horizontal lines are from beachfront terraces left as the Great Salt Lake rises and falls
Hooper began existence as Muskrat Springs. A few years later the name was changed to Hooperville to honor Captain William Hooper, an early Utah Congressman. Hooper is located along the edge of the Great Salt Lake and Fremont Island, a privately owned island that is the third largest island in the Great Salt Lake, is included within the city's boundaries.
Fast Facts about Hooper, Utah
Hooper, Weber County, UT 84315
Latitude: 41.1671°N
Longitude: 112.1178°W
Incorporated: 2000
Elevation: 4,242'
Education:
High School or Higher: 90.8%
Bachelor's Degree or Higher: 16.8%
Graduate or Professional Degree: 4.8%
2011 Cost of Living Index for Hooper: 86.7
Median Resident Age: 31.3 Years
Latitude: 41.1671°N
Longitude: 112.1178°W
Incorporated: 2000
Elevation: 4,242'
Education:
High School or Higher: 90.8%
Bachelor's Degree or Higher: 16.8%
Graduate or Professional Degree: 4.8%
2011 Cost of Living Index for Hooper: 86.7
Median Resident Age: 31.3 Years
2009 Estimates:
Estimated Median Household Income: $73,200
Estimated Median Home Value: $261,500
Population Density: 511 People per Square Mile
Major Industries:
Construction, Government, Health Care, Educational Services, Finance & Insurance Services, Professional Services, Transportation Equipment, Lodging & Food Services, Repair & Maintenance, Miscellaneous Manufacturing
Unemployed (March 2011): 8.4%
Population Demographics: 2010
| Total Population | 7,218 |
| Males | 3,659 |
| Females | 3,559 |
| Population by Age | |
| Under 18 | 2,526 |
| 18 & over | 4,692 |
| 20-24 | 366 |
| 25-34 | 1,080 |
| 35-49 | 1,419 |
| 50-64 | 1,151 |
| 65 & over | 487 |
| Population by Ethnicity | |
| Hispanic or Latino | 382 |
| Non Hispanic or Latino | 6,836 |
| Population by Race | |
| White | 6,827 |
| African-American | 31 |
| Asian | 68 |
| Native American | 46 |
| Hawaiian or Pacific Islander | 5 |
| Other | 110 |
| Two or more | 131 |
