South Ogden, Utah

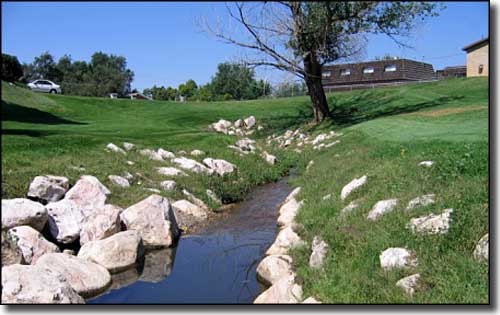
In one of the South Ogden City Parks
South Ogden was first settled by the Daniel Burch family, newly arrived from Kentucky with the Lorenzo Snow company of pioneers in 1848. In 1850, the settlement was named Burch Creek in his honor. It was in 1852 that Burch built a gristmill on the Weber River near the irrigation canal in nearby Riverdale. Burch Creek was a quiet area, even after the Ogden City Council built a six-room isolation facility for smallpox patients in the settlement in 1882. Then in 1890 came a flood of money investing in residential and commercial land developments. The first schools were built in 1897 but there was not enough water supply to serve the community's needs until 1934. Several times over the years the City of Ogden tried and failed to annex the area but the local need for roads, a sewer system, more water and sidewalks finally drove the residents of Burch Creek to seek incorporation. On July 6, 1936, the town of South Ogden opened for business. Construction of Hill Air Force Base fueled a major spurt in population in the 1940's and 1950's. Weber State University is on the east side of South Ogden.
A few years ago, South Ogden elected George Garwood to be the first African-American mayor in the history of Utah.

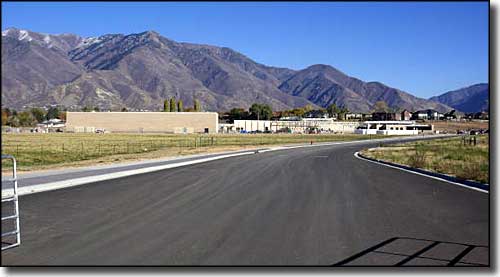
South Ogden Junior High School
Latitude: 41.1748°N
Longitude: 111.9574°W
Incorporated: 1936
Elevation: 4,296'
Education:
High School or Higher: 90.9%
Bachelor's Degree or Higher: 28.1%
Graduate or Professional Degree: 9.2%
2011 Cost of Living Index for South Ogden: 86.4
Median Resident Age: 33.7 Years
Estimated Median Household Income: $53,200
Estimated Median Home Value: $184,300
Population Density: 4,391 People per Square Mile
Major Industries:
Government, Health Care, Construction, Educational Services, Lodging & Food Services, Transportation Equipment, Finance & Insurance Services, Professional Services, Retail Services
Unemployed (March 2011): 8.4%
Population Demographics: 2010
| Total Population | 16,532 |
| Males | 8,098 |
| Females | 8,434 |
| Population by Age | |
| Under 18 | 4,452 |
| 18 & over | 12,080 |
| 20-24 | 1,338 |
| 25-34 | 2,918 |
| 35-49 | 2,546 |
| 50-64 | 2,495 |
| 65 & over | 2,382 |
| Population by Ethnicity | |
| Hispanic or Latino | 2,122 |
| Non Hispanic or Latino | 14,410 |
| Population by Race | |
| White | 14,463 |
| African-American | 237 |
| Asian | 222 |
| Native American | 93 |
| Hawaiian or Pacific Islander | 54 |
| Other | 928 |
| Two or more | 535 |
