West Haven, Utah

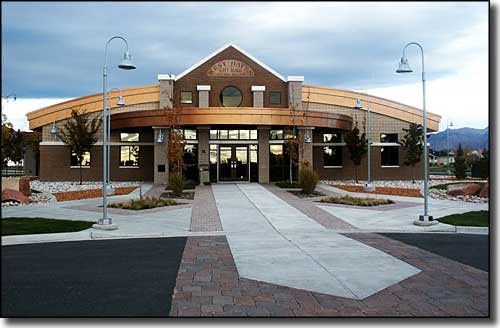
West Haven City Hall
West Haven combined the unincorporated settlements of Wilson and Kanesville in its incorporation in 1991. Both Wilson and Kanesville had long histories as rural, agricultural settlements dating back into the mid-1800's. Since incorporation, the area has slowly been losing its rural roots and ambience as more and more multi-family, multi-story townhouse and condo developments are built in town. Much more of the area has commercial zoning on it than before incorporation, too. The population of West Haven has more than doubled since 2000.
Fast Facts about West Haven, Utah
West Haven, Weber County, UT 84315
Latitude: 41.2027°N
Longitude: 112.0585°W
Incorporated: 1991
Elevation: 4,272'
Education:
High School or Higher: 92.6%
Bachelor's Degree or Higher: 20.0%
Graduate or Professional Degree: 3.8%
2011 Cost of Living Index for West Haven: 85.9
Median Resident Age: 28.3 Years
Latitude: 41.2027°N
Longitude: 112.0585°W
Incorporated: 1991
Elevation: 4,272'
Education:
High School or Higher: 92.6%
Bachelor's Degree or Higher: 20.0%
Graduate or Professional Degree: 3.8%
2011 Cost of Living Index for West Haven: 85.9
Median Resident Age: 28.3 Years
2009 Estimates:
Estimated Median Household Income: $66,000
Estimated Median Home Value: $277,750
Population Density: 941 People per Square Mile
Major Industries:
Government, Construction, Transportation Equipment, Health Care, Educational Services, Professional Services, Building & Garden Materials, Finance & Insurance Services, Waste Management Services, Lodging & Food Services, Automotive Services, Retail Services
Unemployed (March 2011): 8.4%
Population Demographics: 2010
| Total Population | 10,272 |
| Males | 5,189 |
| Females | 5,083 |
| Population by Age | |
| Under 18 | 3,622 |
| 18 & over | 6,650 |
| 20-24 | 752 |
| 25-34 | 1,695 |
| 35-49 | 2,090 |
| 50-64 | 1,272 |
| 65 & over | 558 |
| Population by Ethnicity | |
| Hispanic or Latino | 916 |
| Non Hispanic or Latino | 9,356 |
| Population by Race | |
| White | 9,346 |
| African-American | 101 |
| Asian | 131 |
| Native American | 60 |
| Hawaiian or Pacific Islander | 14 |
| Other | 305 |
| Two or more | 315 |
